Players
Player Strike Zone Case Studies
How did elite hitters respond to the Statcast era? By examining pitch-by-pitch tracking data across pre- and post-Statcast seasons, we trace how superstars like Mike Trout, Paul Goldschmidt, and J.D. Martinez adapted their swing decisions and zone coverage.
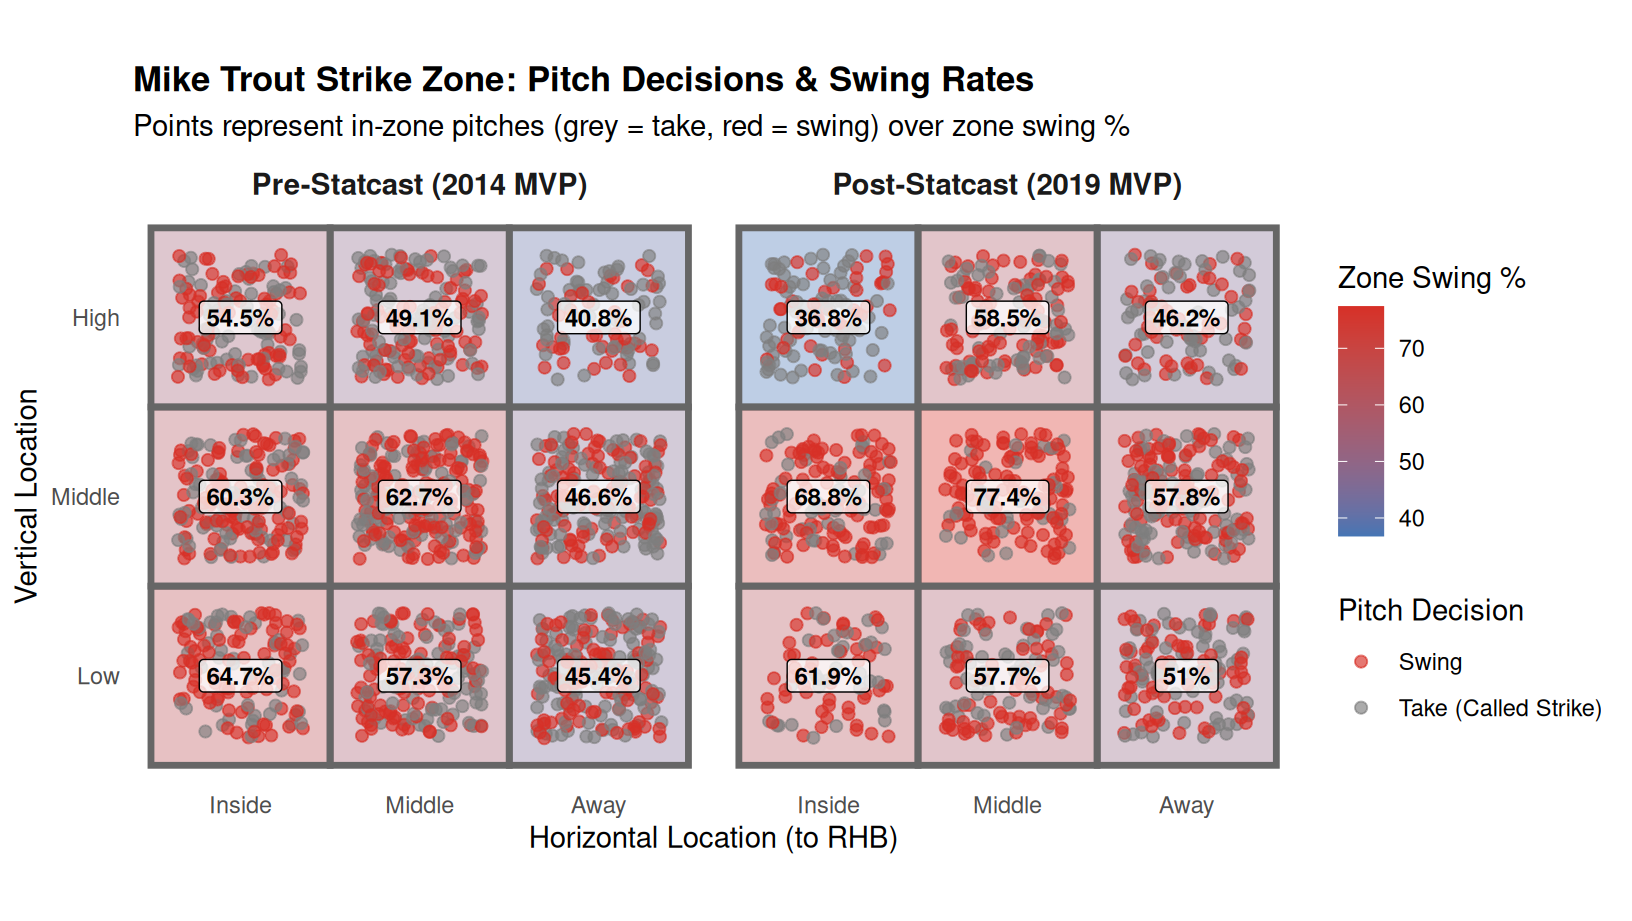
Analyzing Mike Trout’s strike zone between 2014 and 2019 reveals how pitch-tracking data refined modern plate discipline and run production. Hitters learned to become hyper-selective—focusing swings on pitches in the heart of the zone where they do maximum damage, while laying off pitcher-friendly edge locations. Comparing his swing decisions directly with his batting average highlights where his selectivity paid off.
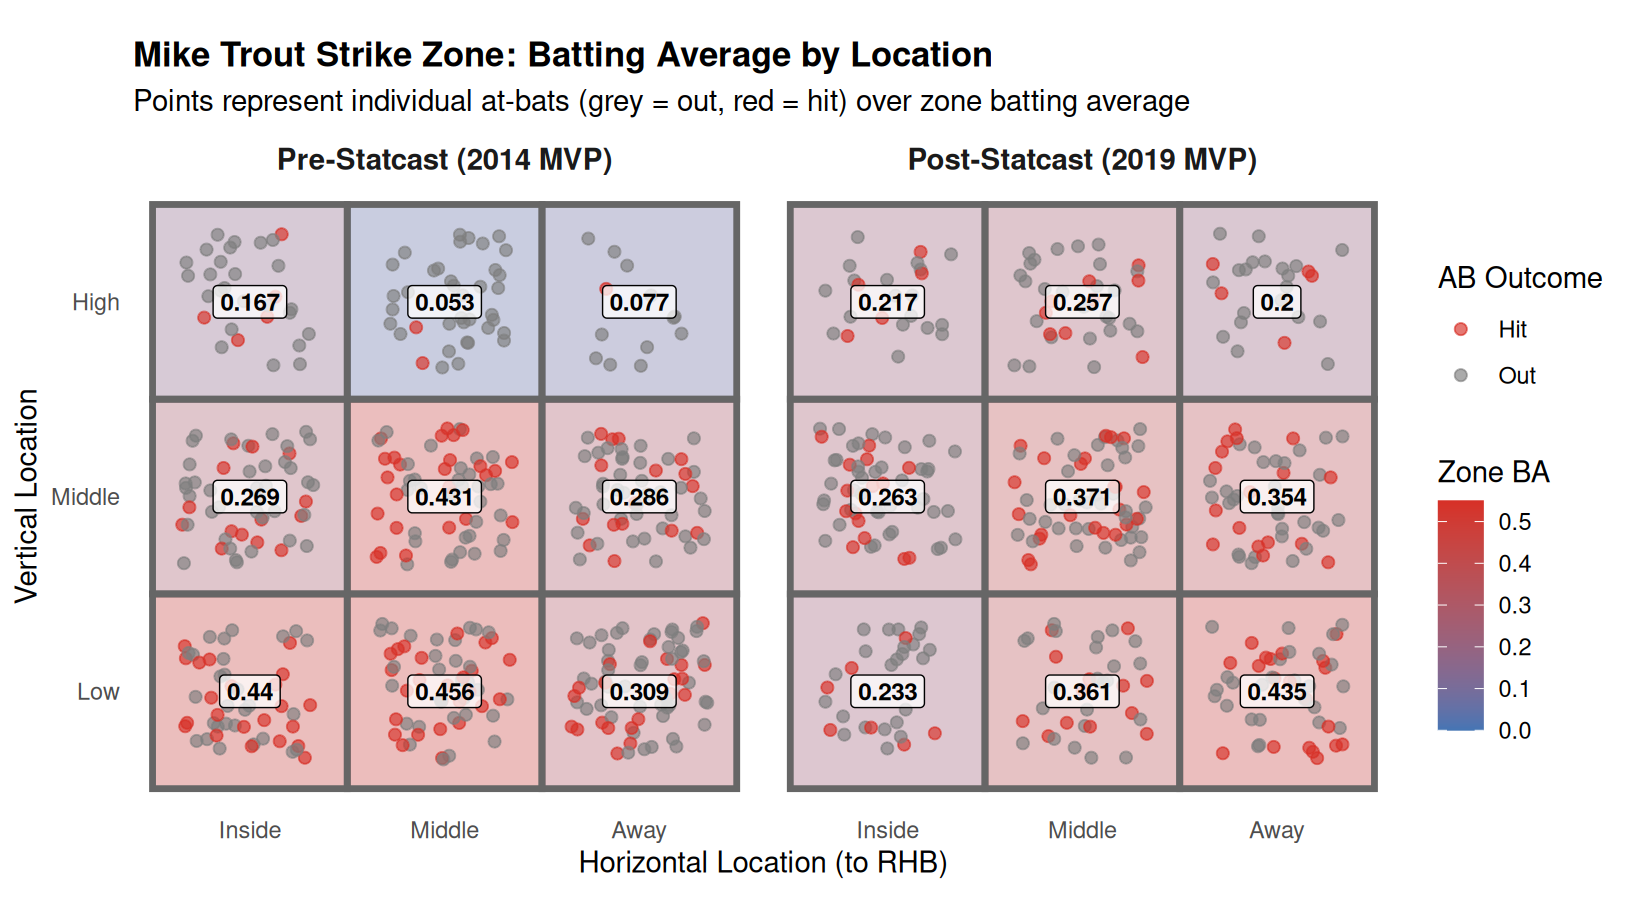
Between 2014 and 2019, Trout dialed his aggression into the middle of the plate—increasing his swing rate in the heart of the zone from 62.7% to 77.4%—while being far more patient on elevated inside pitches (dropping from 54.5% to 36.8%). This selectivity mirrored his results: in 2014, Trout was lethal in the lower and middle regions of the zone (hitting .456 low-middle, .440 low-inside, and .431 in the heart), but struggled on elevated pitches, batting just .053 up-middle. By 2019, Trout dramatically improved his coverage of high pitches—raising his up-middle batting average to .257—while hitting .435 on pitches low-away.
Paul Goldschmidt provides a compelling look at how an elite slugger adapted his swing decisions across nearly a decade of pitch tracking. In his 2013 breakout season with the Arizona Diamondbacks (where he was the NL MVP runner-up), Goldschmidt was particularly eager to attack pitches elevated in the zone, recording a 76.7% swing rate in the upper-middle quadrant and 71.1% mid-in. By his 2022 NL MVP campaign with the St. Louis Cardinals, Goldschmidt adopted a more balanced approach—maintaining a 66.8% swing rate in the heart of the zone while becoming more selective on low and away pitches (49.5% swing rate).
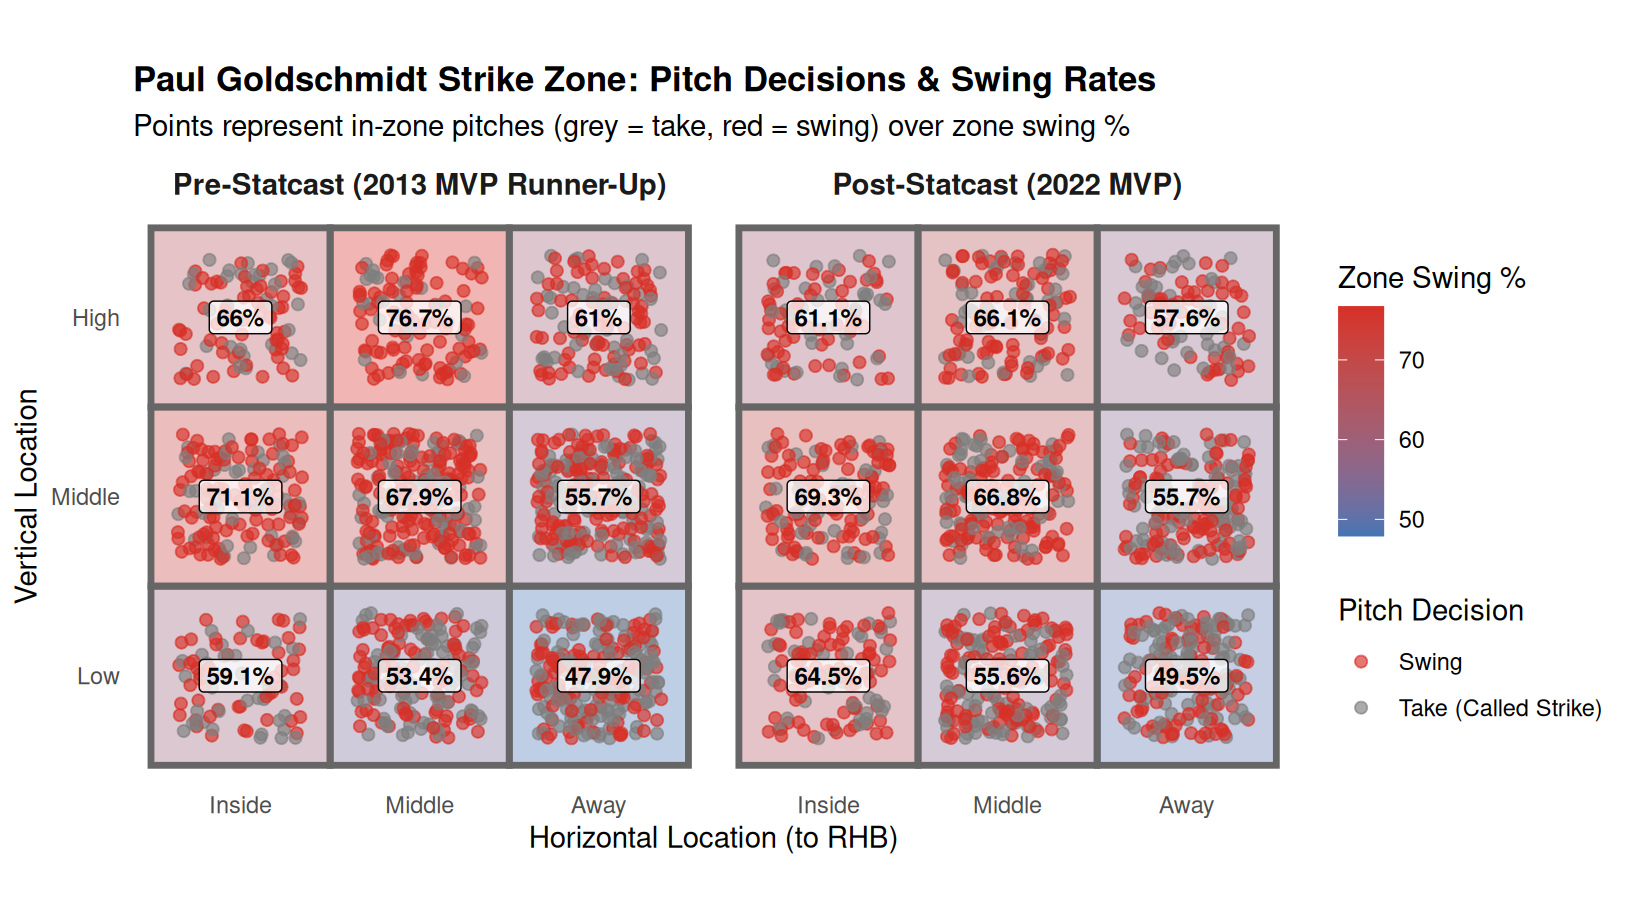
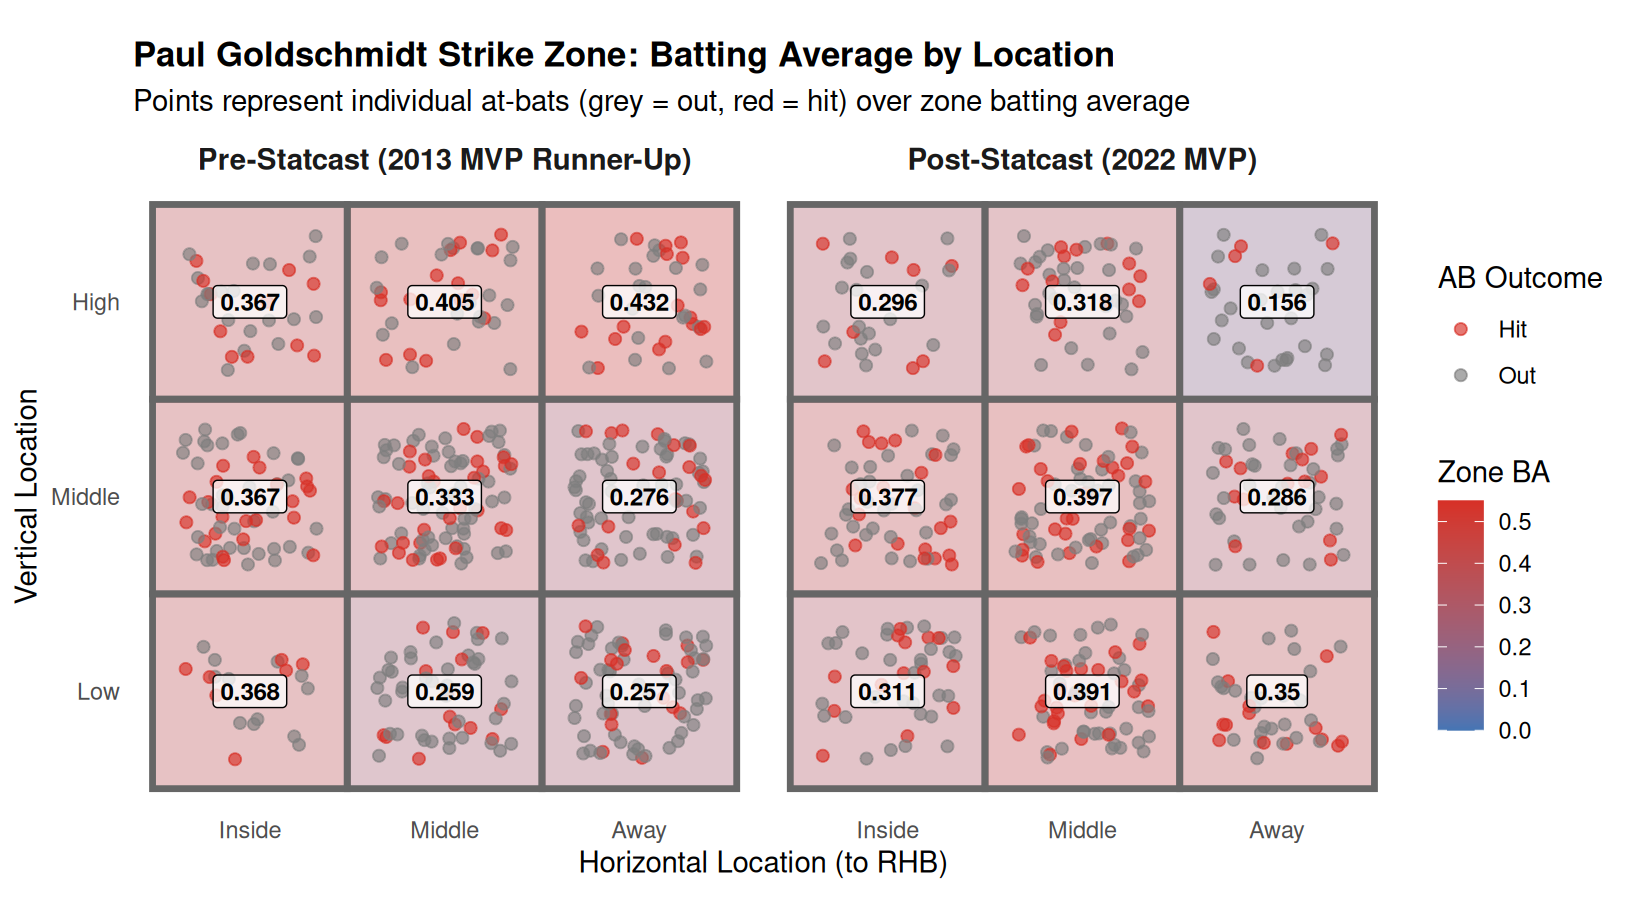
Comparing his 2013 and 2022 seasons reveals how Goldschmidt developed a patient, disciplined approach across the strike zone—remaining aggressive in the heart (66.8%) while cutting swings on outer-edge chase zones. Examining his batting average highlights his shift from a high-ball hitter in Arizona to an all-fields, lower-zone punisher in St. Louis. In 2013, Goldschmidt crushed pitches in the upper third of the strike zone, hitting .432 up-and-away and .405 up-middle. In 2022, pitchers combated his high-ball power, forcing Goldschmidt to adjust down—where he batted .397 in the heart, .391 low-middle, and .350 low-and-away.
After overhauling his swing mechanics prior to the 2014 season, J.D. Martinez emerged as one of baseball’s premier sluggers. By his 2018 championship season with the Boston Red Sox, Statcast data and launch angle optimization helped him refine his plate aggression even further.
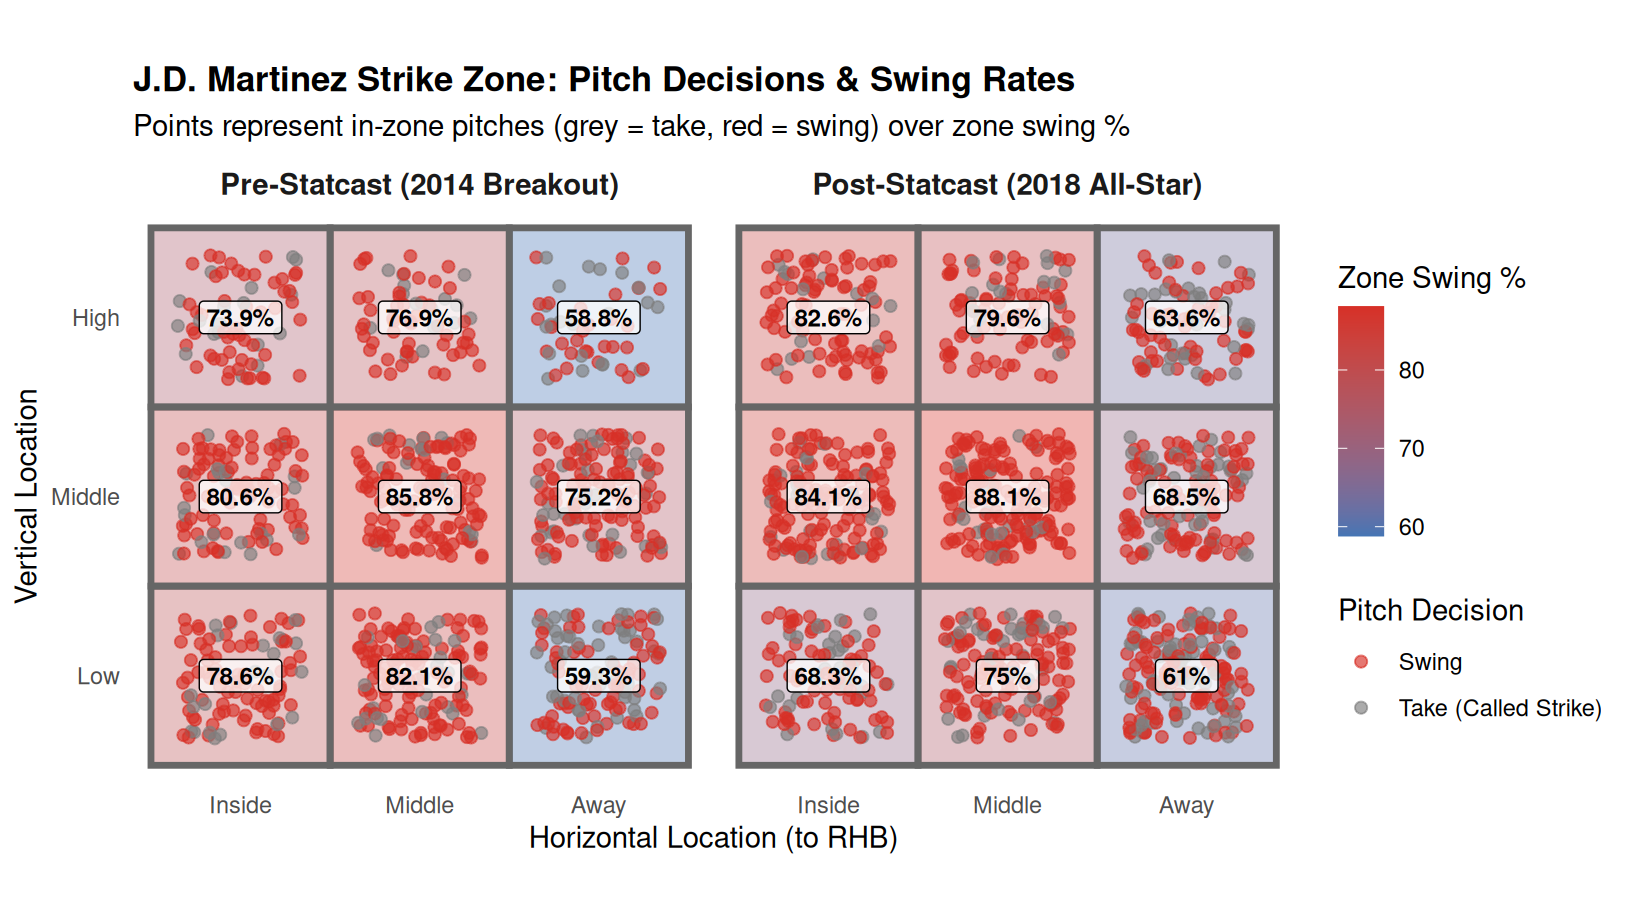
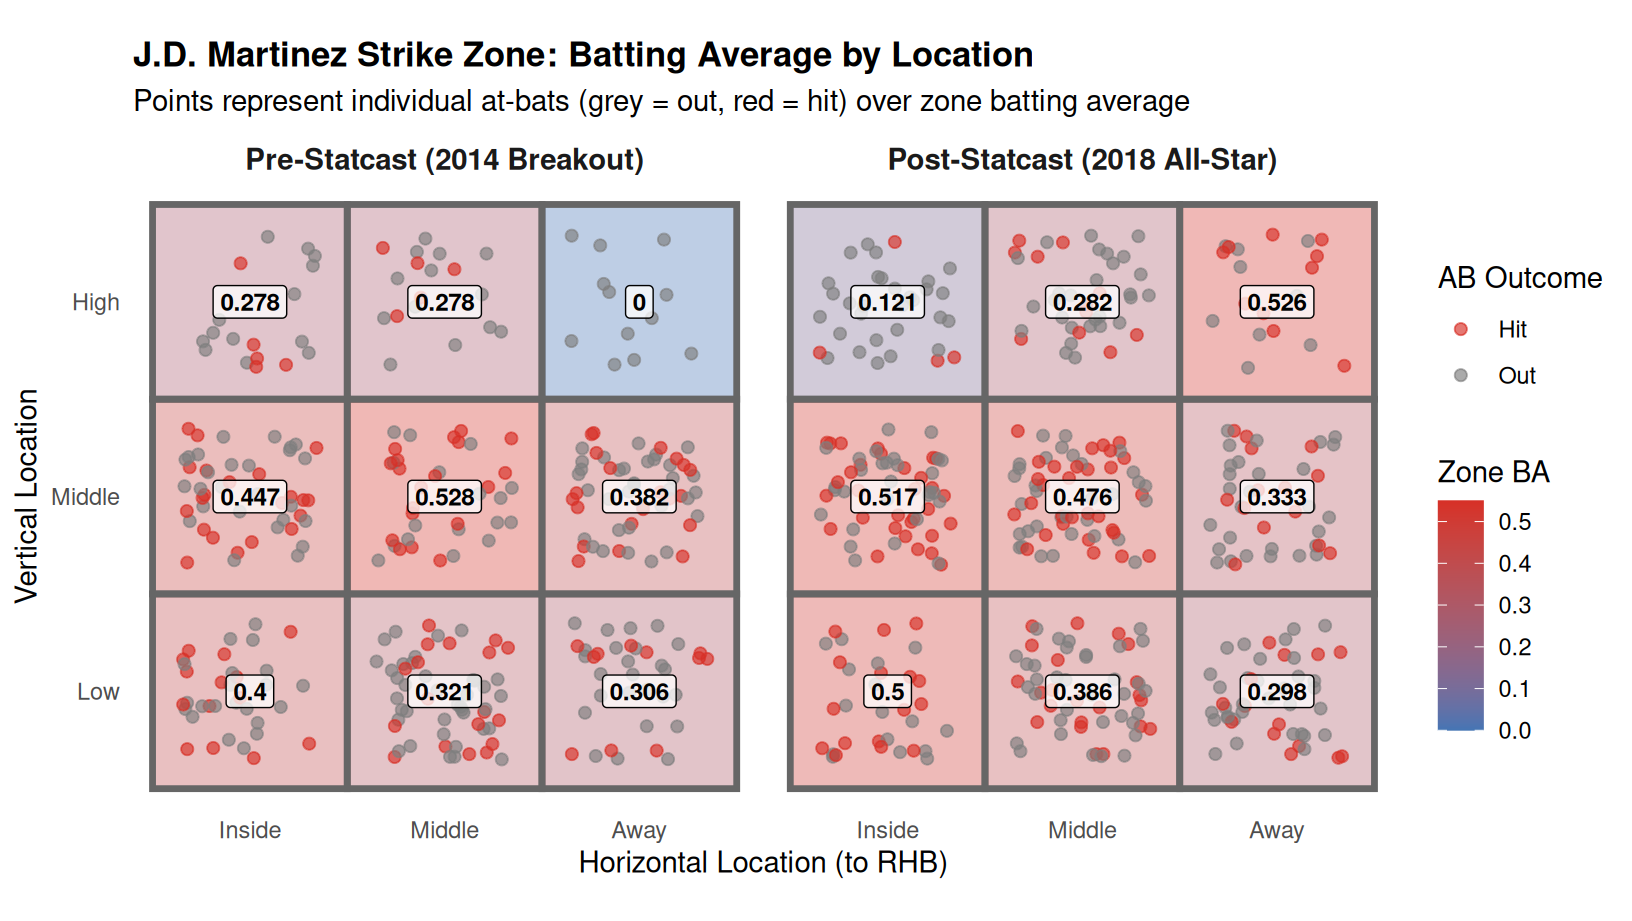
Comparing Martinez’s 2014 breakout in Detroit with his 2018 championship season in Boston highlights how his refined plate discipline fueled elite production. Martinez became markedly more aggressive on pitches elevated in the zone—increasing his swing rate up-and-in from 73.9% to 82.6%—while demonstrating greater patience low-and-in (dropping from 78.6% to 68.3%). Most dramatically, Statcast-driven launch angle optimization helped him expand his damage zone to the outer half: his batting average on pitches up-and-away surged from .000 in 2014 to .526 in 2018, alongside a .517 mark middle-inside.